8 The record-to-report process
It’s strange, I’ve been in the field of accounting for many years, but I’ve only recently started to systematically use goal setting in my personal and professional life. My eyes were decisively opened by one of my favourite author of analytics books, Cole Nussbaumer Knaflic. Cole (I’ll use her first name as I imagine we’re friends) has been working with Google in the People Analytics team for some years, when she decided to start her own venture with storytellingwithdata.com (SWD).
In episode 13 of her podcast, titled ‘goals like Google’, Cole describes how the quarterly goal setting process learned at Google, the OKRS process (where OKRS stands for Objectives and Key Results) was instrumental for her SWD success (and her marital success but that’s another story). The OKRS process has built in goals (what you want to accomplish) and results (how will you accomplish the stated goal). Cole defines quarterly goals (e.g., ‘grow storytelling with data business in Australia and New Zealand’) and results (e.g., present SWD in three broad forums, from Tableau meet-ups to university guest lectures), measures the results and at the end of the quarter, gives grades to the results in order to score the quarter. This process helps Cole focus her work on what is strategically important (such as growing the business) and also to reflect and learn (e.g., if a goal scored really low, was is not so important or did I encounter specific roadblocks in achieving it?).
Companies do a similar thing, they track (or record) results in order to report on them and reflect on what they did well and what they can improve. What are the results that companies record? They record, for example, how much cash they receive and how much cash they pay. They also record what they pay cash for - the purchases they make - and they record the sales that generate cash. With this information they can reflect back: did we purchase too much, did we sell enough, did we manage to receive more cash than what we paid? Depending on the answers to these reflections, companies can improve: we’ll purchase less, we’ll sell more, we’ll sell at a higher price. Companies record other aspects as well, like ‘what are our assets?’ and ‘how effective are we at using them?’, but we’ll focus in this chapter only on recording and reporting about cash, purchases and sales, which is fundamental to any company.
8.1 Record-to-report process
I’ve modelled the report-to-record process focused on cash, purchases and sales of goods in diagram Figure 8.1. This visualization is a very intuitive tool that helps us understand how recording, through the bookkeeping logic, links various aspects of the business. Did I come up with this intuitive, but robust diagram myself? No. This is the product of the internal control thinker, Starreveld (Starreveld et al. (2002)). This diagram is called in the literature on internal control the ‘value cycle’ because value is created in this cycle through purchasing and selling goods. What I like the most about this diagram is that it allows you a very fast entry into the field of bookkeeping, or accounting reporting as it were. I’ll show you what I mean by this after you take some time to study the digram.
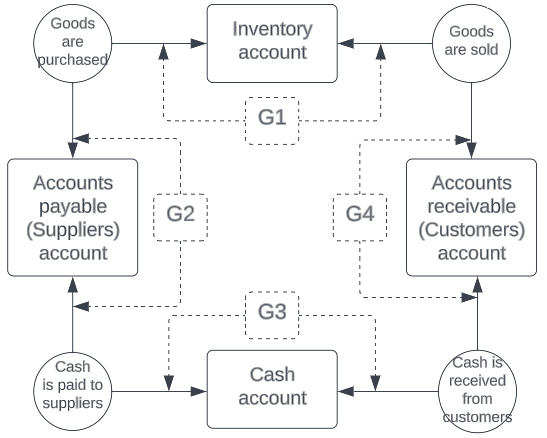
Ready? Did you study the diagram? Without looking at the diagram, how many circles for economic events are in the diagram? Without looking at the diagram, how many squares representing documents are in the diagram?
I wrote before that the diagram of the reporting-to-record process related to the value cycle allows you a fast entry in the world of bookkeeping. Here’s why. Each account in the diagram has a Beginning balance (B) and an Ending balance (E). The Beginning balance (B) increases with (guess what?) Increases (I) and decreases with (guess what?) Decreases (D). This is called the BIDE formula. Let’s see the BIDE formula in action!
For our value cycle accounts, the BIDE formula would state the following:
Beginning balance Inventory (B) + Purchases inventory (I) - Sales inventory (D) = Ending balance Inventory (E)
Beginning balance Cash (B) + Cash receipts (I) - Cash payments (D) = Ending balance Cash (E)
Beginning balance Accounts receivable (B) + Sales inventory (I) - Cash receipts (D) = Ending balance Accounts receivable (E)
Beginning balance Accounts payable (B) + Purchases inventory (I) - Cash payments (D) = Ending balance Accounts payable (E)
Why do we need to know the BIDE formula and how to apply it? Because it helps us perform analytical review control activities, which in turn, will help us achieve our goals.
Our goals for the recording-to-reporting process are to have correctly reported information on inventory (G1), correctly reported information on suppliers (G2), correctly reported information on cash (G3) and correctly reported information on customers (G4). We can achieve these goals using analytical reviews where we reconcile, using the BIDE formula, what-should-be (e.g., the beginning inventory amount + purchased inventory amounts - sold inventory amounts) with what-is (e.g., the ending inventory amount). The four goals are also achieved if on every information flow (so on every black arrow), there is a segregation of duties. For example, the employee that purchases inventory is different from the employee who receives the inventory in the warehouse.
8.2 Questions and application:
- Can you think through what are the consequences for companies who record and report incorrect cash? How about incorrect inventory? How about incorrect Accounts receivable? How about incorrect Accounts payable? Can you describe these consequences using examples from real-life?
- Can you think of numerical examples to test the BIDE formula?
- Can you use the BIDE formula on financial statements from the annual reports of real companies?
- Can you describe all duties that should be segregated, according to our record-to-report process?
- Discover how the record-to-report process works in odoo.