3 How to use this material?
Teaching internal control to (novice) students is difficult. It is common for students of this wonderful art of internal control to say ‘I have no idea what the teacher is talking about’, only to go into practice and to experience an ‘Aha!’ moment when, finally, the concepts of internal control make sense. More importantly, it is difficult to teach internal control because internal control is about common sense and teaching common sense is difficult.
3.1 Activities
Still, despite being a topic difficult to teach, you can still learn it. In order to actually build a solid foundation for internal control, I’ve decided to:
- Focus on processes. Processes can be visualized and that for me is a major advantage as a learning tool. There are other approaches to learning about internal controls. One important approach developed by the Dutch literature (initiated by Starreveld et al. (2002) and expanded by Vaassen and Meuwissen (2020)) was the type-of-organization view of internal control. In this approach you can classify organizations in specific types (e.g., service organization with a limited flow of goods such as restaurants) and this classification can help you identify the risks that need to be controlled (for example, in a restaurant there is a risk that you serve customers something that they did not order). Still, I decided that a process view, given it’s visualization strength, gives a faster insight into internal control than a type-of-organization view.
- Use diagrams to describe processes. These diagrams are loosely based on Krishnan et al. (2005) which base their diagrams loosely on the Business Process Modeling Notation (BPMN). There’s more on these diagrams below. The operative word here is loose as opposed to robust. My intuition is that a loose approach is better for learning, at least at the beginning. We can further increase the robustness of the diagrams during class discussions.
- Use the same diagrams from point 2 above to further describe goals and control activities. I’m going to use the terminology of goals instead of risks, although risk management is intertwined with internal control in basically all the literature available on the topic. But, ultimately, internal control is about supporting organizations to achieve organizational goals. So, we’ll focus on goals instead of risks. I’m also a fan of re-framing in general, and I frequently try to re-frame thoughts such as ‘I have to do the dishes’ into’I get to do the dishes’.
- Use only three big categories of controls: (1) segregation of duties, (2) procedures, and (3) analytical reviews1. The first two categories can be classified as preventive internal controls because you put them in place in order to prevent something bad from happening and to make sure your goals are realized (like when you lock your bike to avoid it from being stolen so that you can use it again). The last category can also be seen as detective internal controls because we check something after the fact, like detectives. This classification that I’m using here is a departure from the classic internal control literature which uses many internal controls categories which sometimes overlap But I’ve decided to use only three main control groups because these can be defined in a way in which they don’t overlap and hence confuse. So, in simple definitions, segregation of duties refers to splitting an activity in parts (for internal control purposes) and have these different parts be performed by different people. Think of when you order drinks in a restaurant and you order them with one waitress and they are brought to you by a different waiter. You are basically splitting the activity of ‘serve drinks’ into two activities, ‘get drink order’ and ‘bring drinks’, which are performed by two different people. What I mean by procedures are any form of formal steps that need to be performed. Like when a waiter receives his salary only after somebody authorizes the salary payment. Analytical procedures are when we check something that is against something that should be. Let’s assume that you order three bottles of beer, but receive only two. You check what-is, two bottles of beer, against what-should-be, three bottles of beer, and that’s how you detect a mistake. Pfiu, this was a long point! Let’s go to the last step.
- Use Odoo as an Enterprise Resource Planning (ERP) system to apply the processes described in diagrams. Using a tool to bring to reality the diagrams and concepts we’ll discuss is very important for learning (because you actually get to apply the concepts you learn and get feedback on this learning when you get errors from the ERP system) but it also gives you an edge as a student. You will be able to put this skill, of using an ERP system, on your CV and that’s not a small matter.
3.2 More on our diagrams
As mentioned before, we’ll describe processes by using diagrams. This type of diagram does not respect the rigour of a specific modelling approaches, such as the Business Process Model and Notation (BPMN), because such notation contain details which are not relevant for our purposes and create extraneous cognitive load. But what’s our purpose? What we want is to have a diagram as learning aid, as a tool which can helps us identify control activities. So once we manage to make a diagram, this diagram should guide us towards the control activities which need to be put in place in order to make sure we are in control of our organization.
In our type of diagram, loosely based on Krishnan et al. (2005), the circles represent economic events (e.g., a customer making an order in a restaurant) and the squares represent information transformation points (ITP) where errors can be introduced. For our purposes, these ITPs are documents, like a Sales order document. Errors can be introduced into ITPs through the black arrows which go into and out of an ITP. These arrows represent information flows. The dashed squares represent organizational goals and the dashed arrows represent control activities linked to these organizational goals.
When describing how controls work for their diagrams, Krishnan et al. (2005) (pp. 311) write that ‘Most detective controls function by comparing information flowing out of an ITP with information flowing into that ITP. Preventative controls function by screening information flowing into an ITP and, thus, prevent the information flowing out of the ITP from containing errors. Irrespective of the type of the control, the objective of the control is to eliminate errors from the information flowing from an ITP’. We won’t always stick to this way of identifying preventive or detective controls but we will aim to identify controls by focusing on the information flows, the black arrows in our diagrams.
Let’s use an example to showcase how our diagrams would be used to formulate organizational goals and pinpoint internal control activities related to these goals. We’ll look at a process hopefully familiar to all of us: ordering drinks in a restaurant (Figure 3.1).
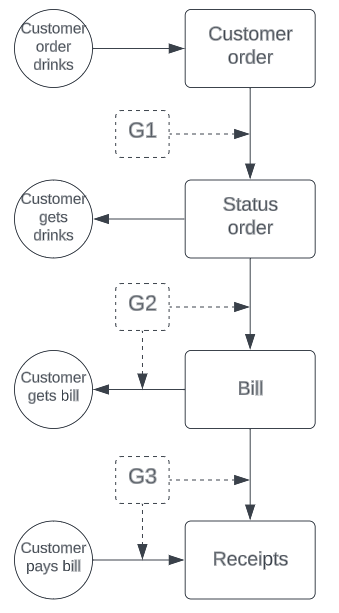
What is the first organizational goal? We’ll look at the black arrow flowing from the Customer order to the order status. Our goal here would be to only serve goods which were ordered (G1). To achieve this goal we might put in place a segregation of duty between the waiter taking the order and the waitress bringing the drinks. Then we can make sure that the waiter did not write in the order four beers only to take three to the customer and keep one for his own consumption. Next, we want to bill the drinks served and only those (G2). Here we might have a procedure that requires the waiter to check (verbally) with the customer that the drinks on the bill were actually received. Finally, we want to make sure that what we charge is also paid (G3). Here, we might employ an analytical review to check what-is, the amount received by the waiter from the customer, with what-should-be, the amount on the bill.
Are you excited to see more of these diagrams in action? No worries, we’ll use them for all our processes. I’ve even made an infographic with all the processes discussed in this book. When you read the text of a process on your laptop, you can easily follow along the diagrams in the printed version of the infographic. You’ll find this infographic in chapter 10 - Fancy infographic.
3.3 Structure
This booklet will first cover five important business processes: the purchase-to-pay process, the order-to-cash process, the production process, the record-to-report process. It will also use an ERP system to bring these processes to life. At the end, in the last chapter, I’ll give the birds-eye-view on the topic’s most well-known frameworks.
3.4 Objectives
What should you be able to do after covering this material? Ideally, you would be able to:
- Reproduce and expand the diagrams of business processes discussed
- Identify internal control goals and internal control activities using diagrams
- Use the most important functionality of an ERP system
- Identify how internal controls are embedded in an ERP system
- Give examples of how internal control is used in organizations
- Explain the core elements of internal control frameworks
So what is the answer to the beginning question ‘How to use this material?’ The answer is to read all the chapters in a sequence and to do the applications for every chapter.
The International Standard on Auditing (ISA) 520 Analytical procedures defines more concretely what I mean by analytical reviews. Nevertheless, given that some people use iterchangeably the terms ‘analytical reviews’ or ‘analytical procedures’ or ‘analytical review procedures’, I’ll use throughout this bookllet the term analytical reviews.↩︎