7 Information provision through storytelling with data
I once attended an event organized for internal auditors. There were a series of presentations planed at this event. The presentations were give by experts in a particular area, they were interesting but not super engaging. There were moments when my mind was drifting away during these ok-ish presentations. But this drifting stopped when something unexpected happened. A lady took the stage to give her presentation. She did not have slides like the rest of the presenters but her presentation was absolutely fantastic. I was at the edge of my chair, figuratively and literally speaking. What did she do, you wonder?
She told us stories.
That moment was a revelation moment for me. I realized then that there were few other moments in my professional career when storytellers made an impact on how I understood a topic or concept. After that presentation, from that lady without slides, I went on to discover all I could about business storytelling.
7.1 What is storytelling with data?
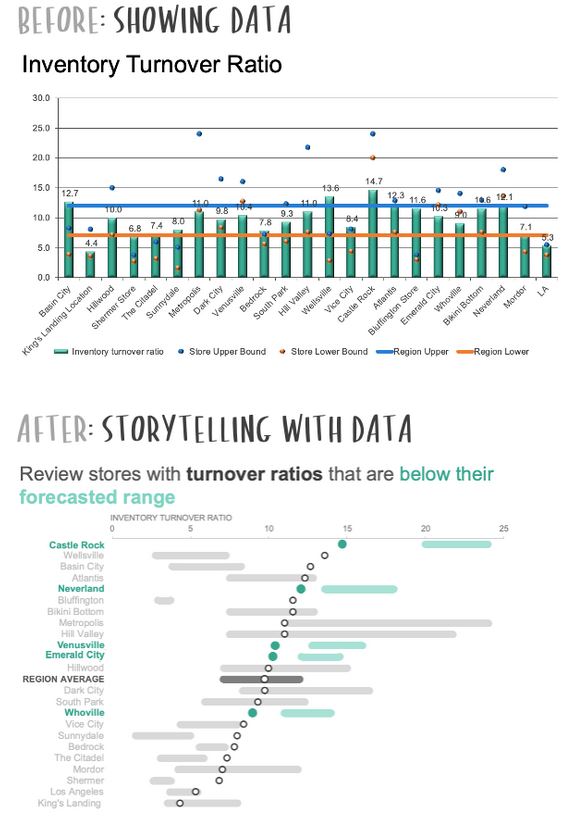
It didn’t take long until I discovered Cole Nussbaumer Knaflic’s work on storytelling with data. At StorytellingWithData they don’t just put you in front of numbers and graphs and hope you get the point, they walk you though the story that the data tells us. I especially like their Cinderella-type-transformation at the makeovers section, where they take an average graph (the Before part from Figure 7.1) and turn it into a ‘princess’ (the After part from Figure 7.1).
Storytelling, including the storytelling with data done by the SWD team, has some important components which I describe in Figure 7.2 .
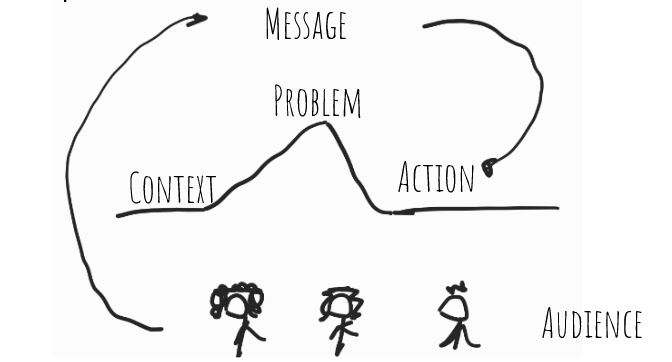
The most important component is the audience. It is a humbling concept to realize that when we are presenting something we do it for them, the audience, and we don’t do it for us, the presenter. This is a powerful shift that storytelling pushes us to do, to consider our audience’s interests instead of trying to show off as a presenter. So, remember that in storytelling it’s not about you, it’s about them!
Next, every story needs to have a clear message of what we want the audience to know or to do (e.g., we want the audit partner to know that sales and cost of goods sold move in an unusual pattern). This is again often overlooked in business communication when we put everything we know on the table. We should not do that. Instead, we should filter through the data and information that we have to present to find the most relevant message. The message comes back also in the end of the story, the resolution, when we call the audience to action, where they need to do something (e.g., approve move evidence gathering on sales transactions). The story also forces you to clearly understand the context and present this context so that both you and your audience start from the same ‘place’ in the communication. Lastly, a super important part of every story is the tension, the question, the problem that we are trying to solve (e.g., are there any suspicious patterns related to sales). As Knaflic says it ‘If there is no problem to solve, then we should not communicate’.
7.2 Does an auditor need to do storytelling with data?
I remember biking once between some villages and seeing the logo of a small accounting company (let’s call it ‘Accountants4U’) which was something like this ‘Accounts4U: Because numbers must speak!’ Although this was the sign for a small accounting company, this is true for the entire profession: accountants must tell the story behind the numbers (e.g., did the company perform well last year? does the company have enough cash to pay its debts?).
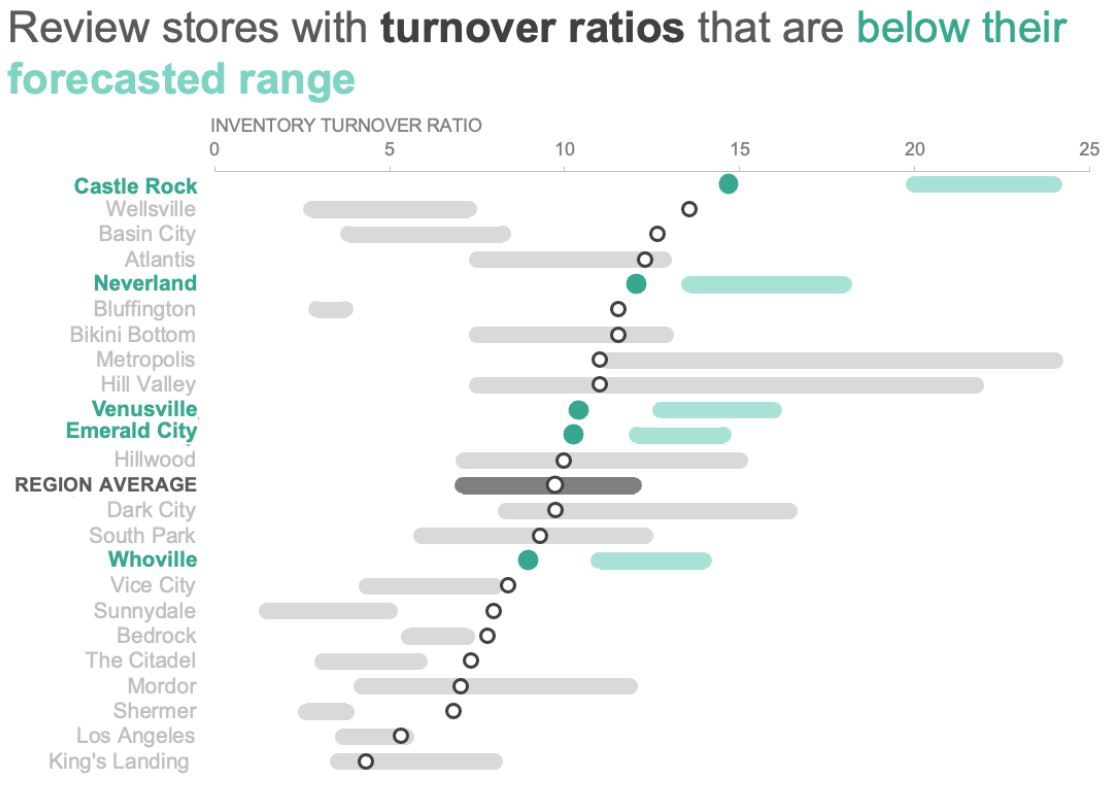
Auditors (who are actually called ‘accountants’ in Dutch) can be more effective and more efficient if they use storytelling with data. Consider the makeover done by SWD on inventory turnover information (Figure 7.1). In that makeover, a messy graph that was losing the reader among different colours and shapes, was turned into a graph that was zooming in on possible areas which need to be investigated in more detail (e.g., Figure 7.3 has the message to ‘Review stores with turnover ratios that are below their forecast range’).
7.3 What to do if you need to write?
The business world, including the auditing domain, involves a lot of written communication. As such, good writing is fundamental for any business graduate. More importantly, good writing can be a competitive advantage for you as an employee, as your message will be received more easily by the reader. Last but not least, good writing is a form of respect for the reader. Good writing cuts to the chase and does not leave the reader with a headache.
A classical read in business writing is the work of Barbara Minto, The pyramid Principle: Logic in Writing and Thinking. According to Minto, writing business communication should be done using the shape of a pyramid were the summarizing message is given before individual supporting ideas are presented. From work cited in Minto’s book, it seems that the mind automatically sorts information into distinctive pyramidal groupings in order to comprehend it. Any grouping of ideas is easier to comprehend if it arrives pre-sorted into its pyramid. This suggests that every written document should be deliberately structured to form a pyramid of ideas: always give the summarizing message before you give the individual ideas who support the summarized message.
Operationally, the pyramid way of writing includes:
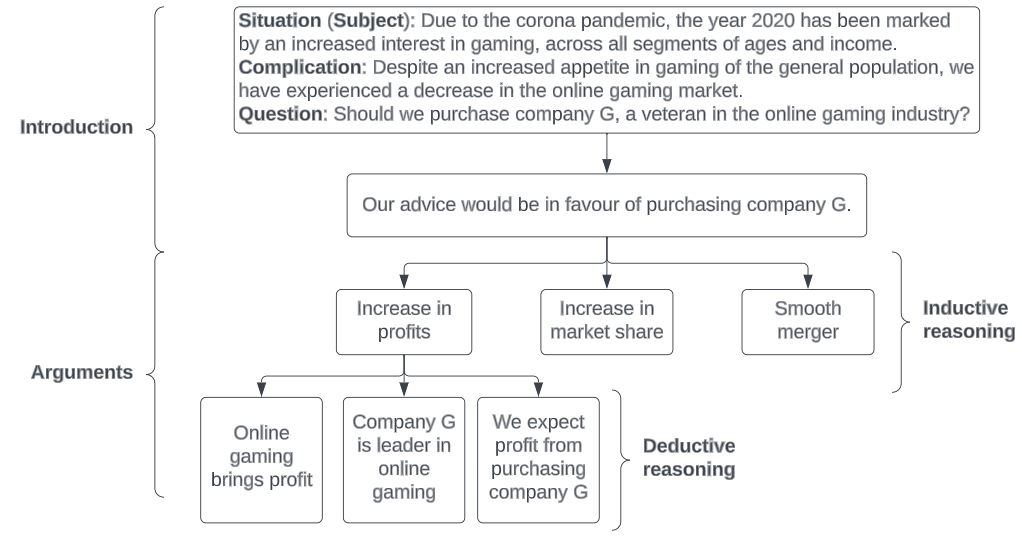
- an introductory flow (with a Situation (and Subject), Complication, Question and Answer) and
- inductive or deductive Arguments
Start the introductory flow by establishing for the reader the (1) Situation with which the reader is familiar with. In that Situation something must occur, a (2) Complication with which the reader is also familiar with, that would cause her to raise the 3) Question to which your document will give her the 4) Answer to. So, the pattern of the introduction in a written communication is Situation-Complication-Question-Answer. This type of introduction makes sure the reader stands in the same place as you, the writer, before embarking on the Arguments which answer the question.
Next, arguments should be presented in a deductive or inductive way. Deductive arguments are the ones that use successive steps: first you present a statement about a situation (e.g., Men are mortal), the second idea comments on the subject or the predicate of the initial statement (e.g., Socrates is a man) and the third idea states the implications of the two statements (e.g., Therefore Socrates is a mortal). On the other hand, inductive arguments will take a set of ideas that are related simply by the fact that you can describe them all by the same plural noun (e.g., all items described in the inductive argument are profit increasing activities).
The figure Figure 7.4 shows a summary of the pyramid principle in action, with the descriptive narrative in the description of the figure.
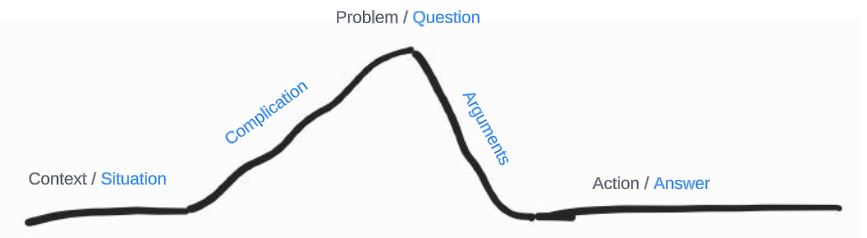
If we would overlay the SWD storyline with the pyramid principle of Minto, the imagine would probably look like Figure 7.5.
7.4 Applications
- Read chapter one - the importance of context from SWD (Knaflic Nussbaumer 2015). Next, describe a specific audience an accountant might have to communicate to and a possible topic of communication. You can identify the audience and the topic of communication from your own experience or from experiences of colleagues and friends who are accountants or who work with accountants. You can also identify the audience and the topic of communication in secondary sources such as articles, reports, blogs. Next, for the audience and the topic of communication identified, create a Big Idea and a Storyboard in line with the ideas discussed in SWD’s chapter one - the importance of context.
- Read chapter two - choosing an effective visual from SWD. Next, imagine a small dataset (e.g., three columns and four rows) that could be used to communicate to the same audience and about the same topic as point one above. Based on the imagined dataset, create a table, a line graph and a bar chart using R. Discuss the advantages and disadvantages of each visualization (i.e., table, line graph, bar chart) for your particular situation.
- Read chapter seven - lessons in storytelling from SWD. Using the audience and the topic identified at point one above and the data from point two above, create a story incorporating the lessons from chapter seven - lessons in storytelling (you can use slides for this). For a video example, Cole Nussbaumer Knaflic does storytelling using data in the last minutes of her video on ‘Five easy tips for better data communication’.
- Read chapter eight - pulling it all together from SWD. Download this data and this data. Open R and merge the two datasets. Then, create different visuals (at least five) based on this data and based on the approaches followed in chapter eight (e.g., clutter elimination, focus attention). Assess each visual: What do you want to enable your audience to see? Which of the visuals would facilitate that and why? Which visuals do not facilitate that and why?
- Pick a report you’ve recently written (e.g., a draft of a research note). Re-write parts of the report using the principles of Minto’s pyramid style of writing.