3 Data collection & storage in the record-to-report process
It’s strange, I’ve been in the field of accounting for many years, but I’ve only recently started to systematically use goal setting in my personal and professional life. My eyes were decisively opened by one of my favourite authors of analytics books, Cole Nussbaumer Knaflic. Cole (I’ll use her first name as I imagine we’re friends) has been working with Google in the People Analytics team for some years, when she decided to start her own venture with storytellingwithdata.com (SWD).
In episode 13 of her podcast, titled ‘goals like Google’, Cole describes how the quarterly goal setting process learned at Google, the OKRS process (where OKRS stands for Objectives and Key Results) was instrumental for her SWD success (and her marital success but that’s another story). The OKRS process has built-in goals (what you want to accomplish) and results (how will you accomplish the stated goal). Cole defines quarterly goals (e.g., ‘grow Storytelling With Data (SWD) business in Australia and New Zealand’) and results (e.g., present SWD in three broad forums, from Tableau meet-ups to university guest lectures), measures the results, and at the end of the quarter, gives grades to the results in order to score the quarter. This process helps Cole focus her work on what is strategically important (such as growing the business) and also to reflect and learn (e.g., if a goal scored really low, was is not so important or did I encounter specific roadblocks in achieving it?).
Companies do a similar thing, they track (or record) results in order to report on them and reflect on what they did well and what they can improve. What are the results that companies record? They record, for example, how much cash they receive and how much cash they pay. They also record what they pay cash for - the purchases they make - and they record the sales that generate cash. With this information they can reflect back: did we purchase too much, did we sell enough, did we manage to receive more cash than what we paid? Depending on the answers to these reflections, companies can improve: we’ll purchase less, we’ll sell more, we’ll sell at a higher price. Companies record other aspects as well, like ‘what are our assets?’ and ‘how effective are we at using them?’, but we’ll focus in this chapter only on recording and reporting about cash, purchases and sales, which is fundamental to any company.
3.1 The record-to-report process
I’ve modelled the report-to-record process focused on cash, purchases and sales of goods in diagram Figure 3.1. This visualization is a very intuitive tool that helps us understand how recording, through the bookkeeping logic, links various aspects of the business. Did I come up with this intuitive, but robust diagram myself? No. This is the product of the internal control thinker, Starreveld (Starreveld and Joëls (2002)). This diagram is called in the literature on internal control the ‘value cycle’ because value is created in this cycle through purchasing and selling goods. What I like the most about this diagram is that it allows you a very fast entry into the field of bookkeeping, or accounting logic as it were. I’ll show you what I mean by this after you take some time to study the diagram.
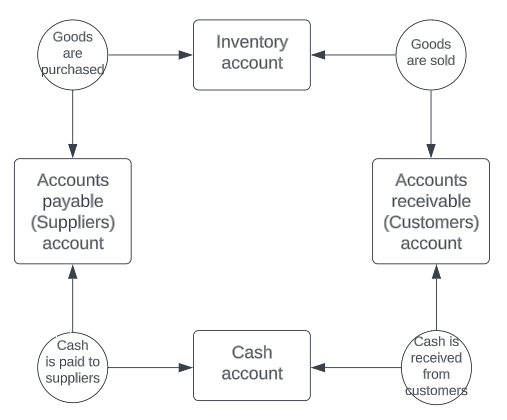
I wrote before that the diagram of the record-to-report process related to the value cycle allows you a fast entry in the world of bookkeeping. Here’s why. Each account in the diagram has a Beginning balance (B) and an Ending balance (E). The Beginning balance (B) increases with (guess what?) Increases (I) and decreases with (guess what?) Decreases (D). This is called the BIDE formula. Let’s see the BIDE formula in action!
For our value cycle accounts, the BIDE formula would state the following:
Beginning balance Inventory (B) + Purchases inventory (I) - Cost of sold inventory (D) = Ending balance Inventory (E)
Beginning balance Cash (B) + Cash receipts (I) - Cash payments (D) = Ending balance Cash (E)
Beginning balance Accounts receivable (B) + Sales inventory (I) - Cash receipts (D) = Ending balance Accounts receivable (E)
Beginning balance Accounts payable (B) + Purchases inventory (I) - Cash payments (D) = Ending balance Accounts payable (E)
We’ve seen the process in a diagram now but how does the process happen in real life? This leads us to the need to understand how accounting data is often collected and stored in real companies using an ERP systems (where ERP stands for Enterprise Resource Planning).
But first, a story!
3.2 Enterprise Resource Planning system
While studying to become an auditor, you decided to start your side business as a dog walker. You love dogs and you figured that walking dogs is both healthy and is helping the community by offering a useful service. You also found out that walking dogs it’s quite profitable. You did all your research, discovered possible clients and decided on your products and prices. You found three clients who would like you to walk their dogs named Rover, Challa and Ravioli (these are the names of the dogs, not the clients).
You’ll invoice your clients monthly. For your administration, you are using a spread sheet to track your products, clients and invoices, like below (Figure 3.2).
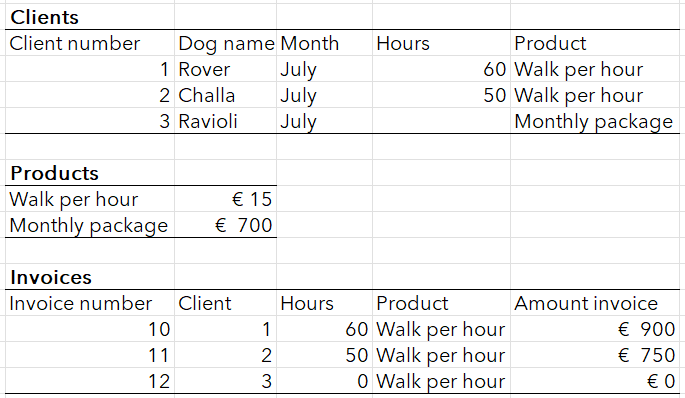
I’ll just be brief and tell you that the administration, like most spread sheets, contains a big mistake. Can you spot it?
Don’t worry, I’ll wait.
Yes, still waiting…
Yes, you got it! The invoice for the third client, the owner of Ravioli, is incorrect! You are missing out on €700!
My claim is that, if you would use an integrated system, one that would unite seamlessly your products with your clients and your invoices, then you can avoid having mistakes in your calculation. ERP systems (where ERP stands for Enterprise Resource Planning) promise to integrate all the information a business needs into one place. In our dog walking example, although you would still have to input your products and your clients, you could automatically generate an invoice, with correct amounts this time. If an ERP system has advantages for such a small business, like a dog walking business, then we can just imagine the advantages it has for a big business, with a lot more information to manage.
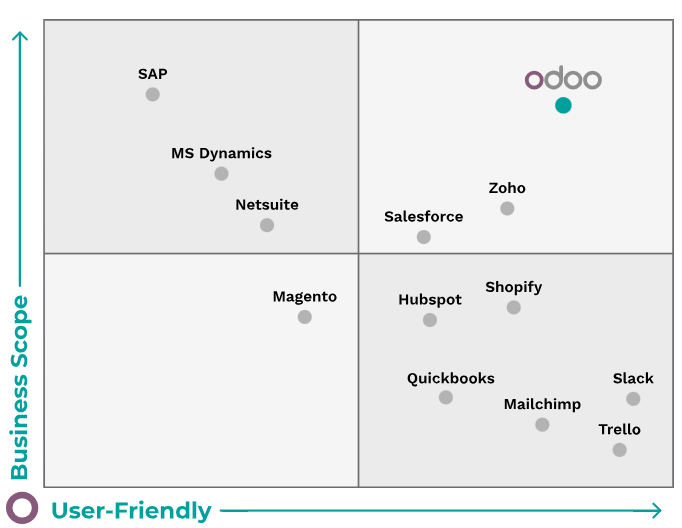
If you want to see how an ERP system looks like, then you can have a look at Odoo. Odoo is an European product that serves a diverse population. It does so because it’s an open source product which functions well. The usual problem of more visible ERP systems such as SAP, especially for an educational setting, is that they are quite comprehensive and - perhaps due to this - are not very intuitive and require intense upfront training. With Odoo, the entry level is quite low and allows for a beginner user to grasp it’s workings very fast. A comparative analysis presented on the website of Odoo shows the difference between Odoo and other ERP systems or business applications (Figure 3.3).
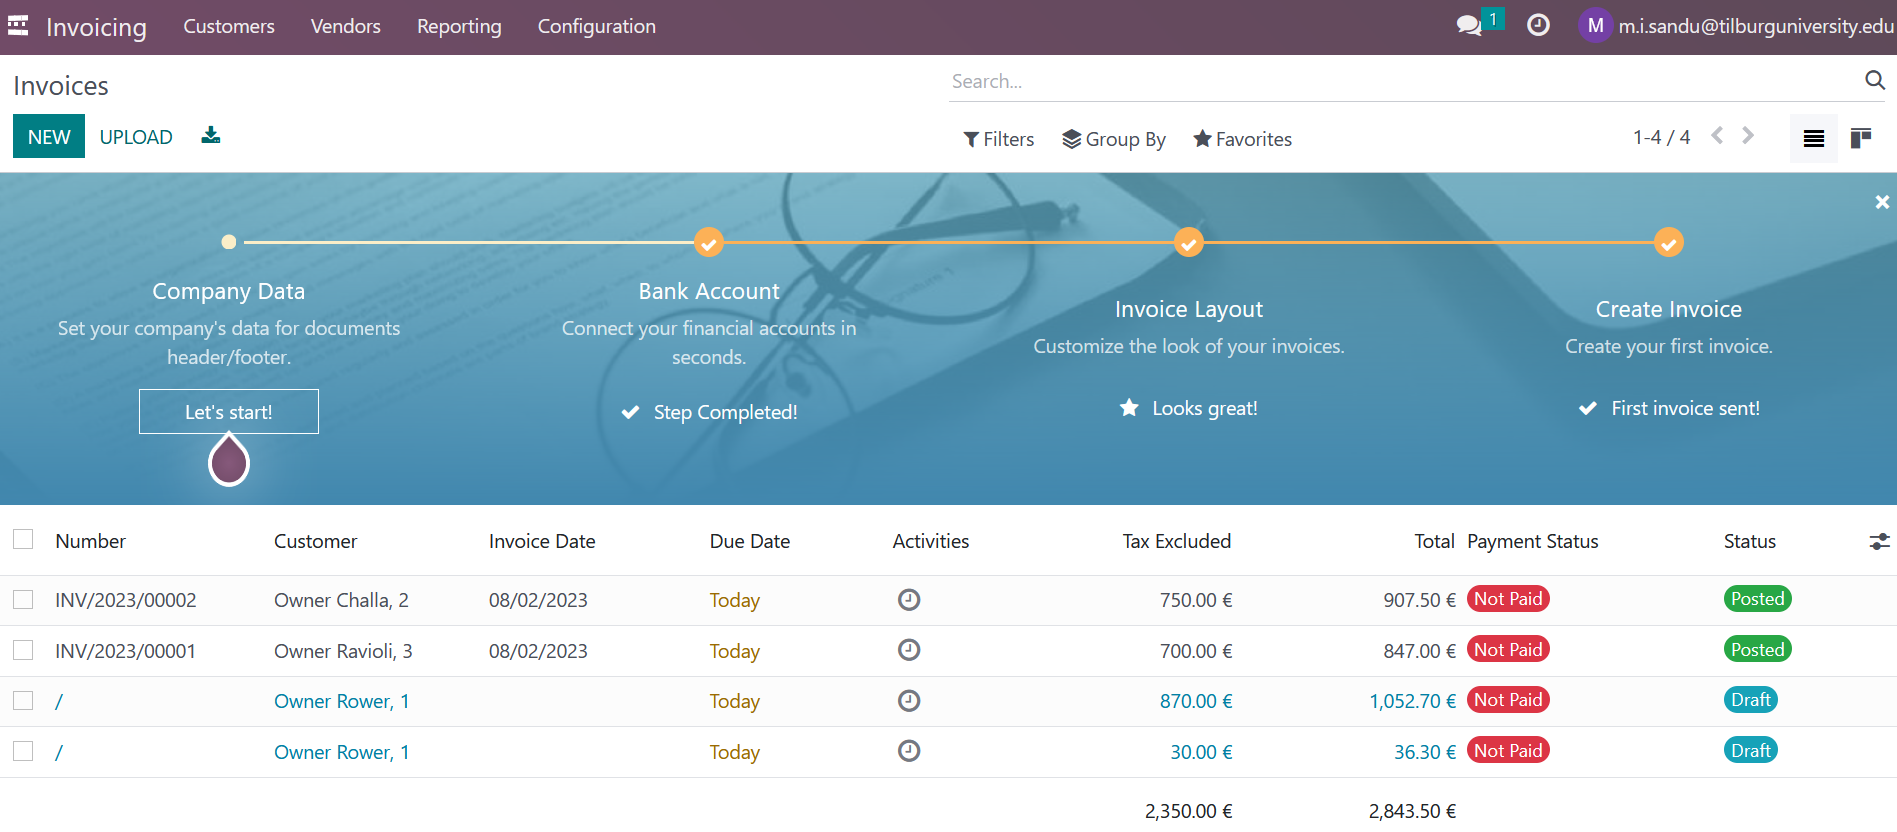
On the inside, Odoo has apps (e.g., the Sales app) and windows which allow you to input data (Figure 3.4).
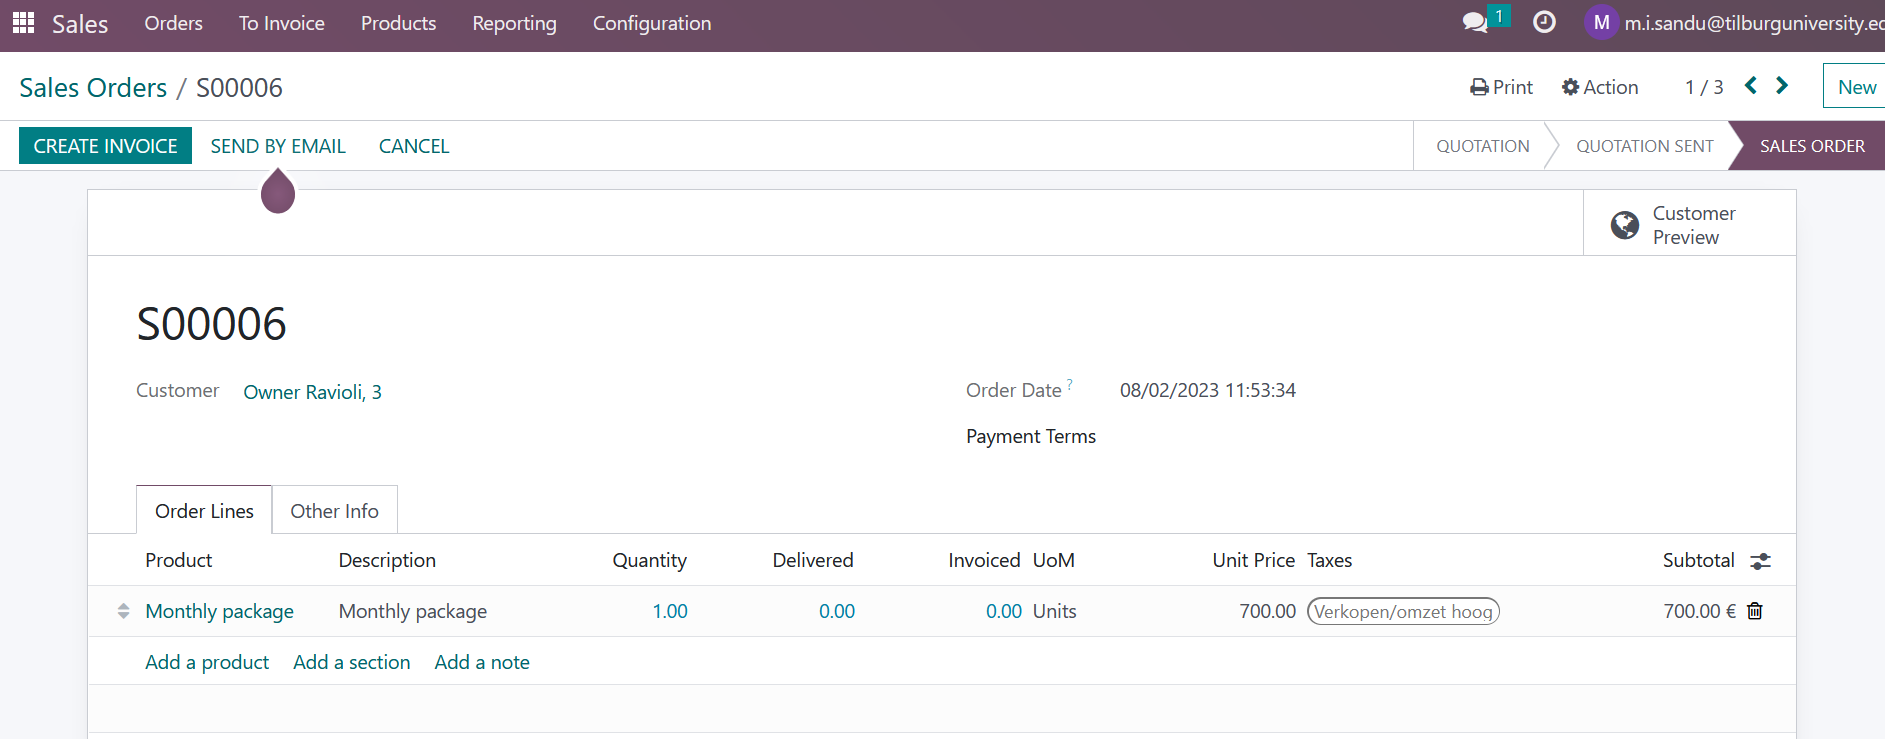
An ERP system also allows for the automation of important tasks such as the creation of invoices. We can see in Figure 3.5 that Odoo makes sure we don’t make mistakes in our calculations and that we do invoice the correct amount (€2.350 without taxes).
3.3 XBRL
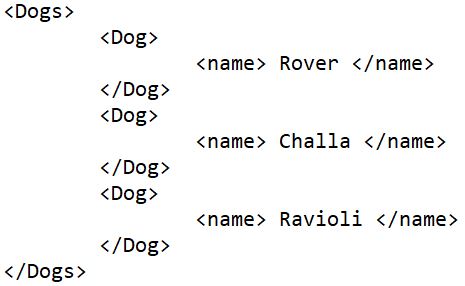
An ERP system can help us collect and store business data. But how would we share this data, especially with parties external to our business? Let’s be more specific. Following up on the dog walking example from above, let’s say that for pet insurance purposes, you need to report the fact that you are walking three dogs. You could write a text message to the pet owners ‘I am walking Rover, Challa and Ravioli’ but this text cannot easily be used to make an analysis (e.g., calculate the total number of dogs). In order to communicate data which is easier to analyse with software, we could use XML. XML stands for eXtensible Markup Language and it is a standard which allows us to store and share data. An XML document is readable by both humans and computers and it uses tags (or marks <>) which can be extended (i.e., it allows for the creation of tags which answer our needs). In our example, we might have an XML document as in Figure 3.6 where the tags used are extended for our needs of reporting the dogs we walk (i.e., the tags we use are Dogs, Dog and name).
The accounting domain borrowed the concept of XML documents and developed its own tags to report standardized financial information. The XML documents used to report financial information are XBRL documents where XBRL stands for eXtensible Business Reporting Language. The tags used in XBRL are financial tags agreed upon in taxonomies such as the CashCashEquivalents tag. The chapter Risk Assessment and Planning (Westland (2020)) presents a case study on how data stored in an XBRL format can be used for data analytics purposes. We’ll work with this chapter in the applications of this section.
3.4 Simulating accounting data
Let’s say you had a big fight with your significant other. You took some time to cool off. Then, you reached out and arranged a date so you can discuss and attempt a reconciliation. You go to your date full of hope. You have many issues that are important to you and would like to discuss with your partner, e.g., you would like for both of you to share responsibility over weekly dinner preparations. You arrive at the date location, see your partner and start talking. But, Oh No, the conversation goes all over the place and you don’t even manage to discuss dinner preparations plans! You begrudgingly reconcile but you have a sinking feeling that big issues are not solved. Don’t you wish you’ve written things on paper, in a list of items to discuss?
Similarly to making lists with important items, simulations of fake data force you to think before you act. Simulating data forces you to ‘put your assumptions on paper’, or in our case, to put our assumptions in code (e.g., how many customers does the company have?, how fast do customers pay?, how many errors do we expect in the data?). Once we’ve simulated data according to our assumption, we can compare it with the real data and investigate the differences we find (e.g., there are many more errors in the data than expected; why?). Chapter Simulated Transactions for Auditing Service Organizations (Westland (2020)) guides us in the simulation of accounting data. We’ll work with this chapter in the application of this section.
3.5 Questions and application
- Can you think of numerical examples to test the BIDE formula?
- Can you use the BIDE formula on financial statements from the annual reports of real companies?
- Read the sections Accessing the SEC’s EDGAR Database of Financial Information and Caveats on accessing EDGAR information with R from page 65 to 76 in the chapter Risk Assessment and Planning (Westland (2020)). Work to reproduce the code in these sections. Based on this work, what are the analyses that can be performed with XBRL data?
- Read the chapter Simulated Transactions for Auditing Service Organizations (Westland (2020)) and answer the following questions:
- What are the steps made in the simulation?
- What (statistical) assumptions are made about the distribution of accounting transactions and which R functions implement these assumptions?
- Replicate the code in the chapter. While replicating the code, make a list of the parts in the code you don’t understand or are not sure about.