5 Data processing in the purchase-to-pay process
Let’s assume you’ve recently discovered the work of Cal Newport on time planning (and if you did not yet, then you should!). You are convinced that what he preaches is gold and you have decided to purchase The Time-Block Planner - A Daily Method for Deep Work in a Distracted World. You then go to your favourite web shop and purchase the Time-Block Planner. The joy! Imagine how productive you’ll be once you get that planner!
But your joy dissipates when you get an email with the text ‘We are writing to offer our heartfelt apologies for the delay in delivering your recent order for The Time-Block Planner. The unexpected surge in demand for the product you ordered, has caused a delay in restocking the item.’ What? How are you supposed to continue your work now?
What happened behind the scenes with the web shop? A first guess is that they mismanaged the inventory of Time-Block Planners.
Inventory is often also the topic of fraud. One iconic fraud case related to inventory is the case of Crazy Eddie. In a documentary describing the fraud, the film makers describe a ridiculous but real situation where Crazy Eddie staff members would make a wall of boxes that the auditor could not easily cross (Figure 5.1).
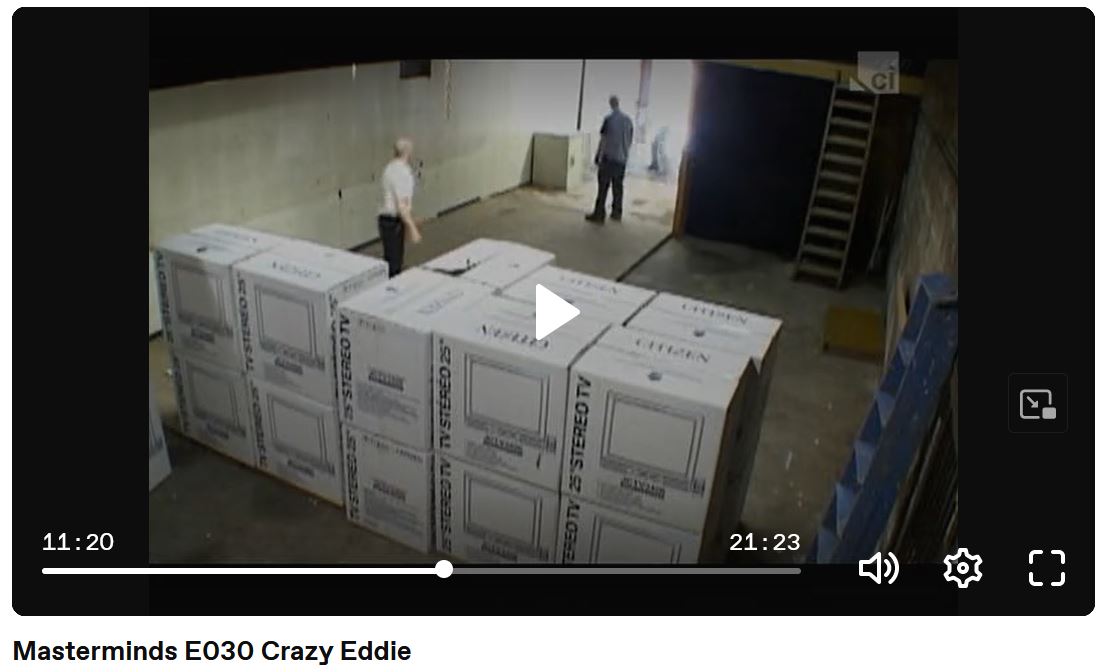
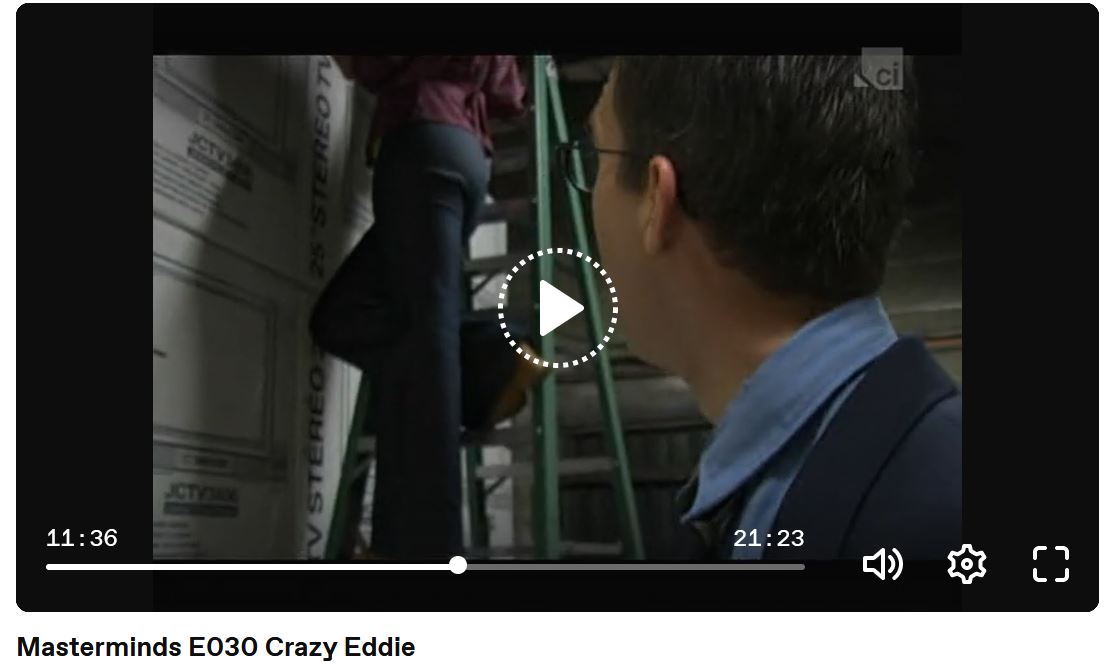
Then, a helpful employee of Crazy Eddie would climb a ladder and would claim that the rows of boxes stretched until the back of the warehouse while, in reality, there were only two rows of boxes (Figure 5.2).
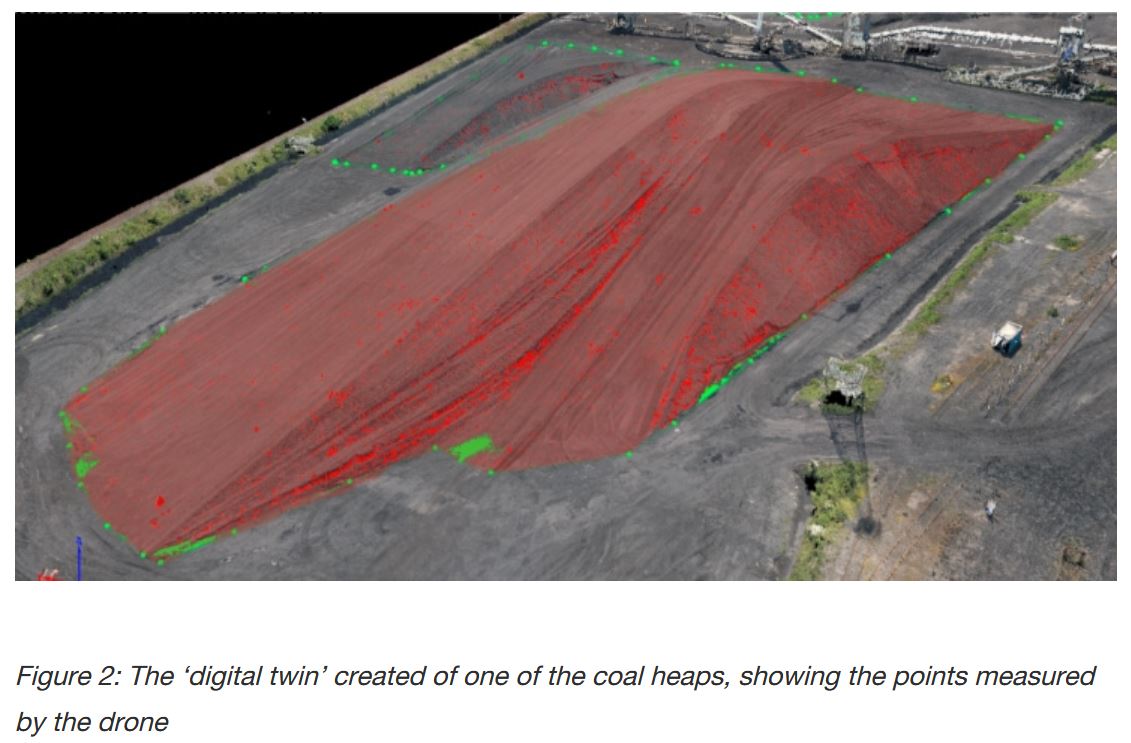
Nowadays, technological innovations are changing the way inventory counting is done. For example, instead of using auditors to climb over ‘the coal pile [of UK’s last remaining coal-fired power stations] and using a two metre GPS tracking pole to measure the area and elevation from the ground at various points’ (press release PwC), PwC used drones to capture the size of size of the coal pile more accurately (Figure 5.3).
5.1 The purchase-to-pay process
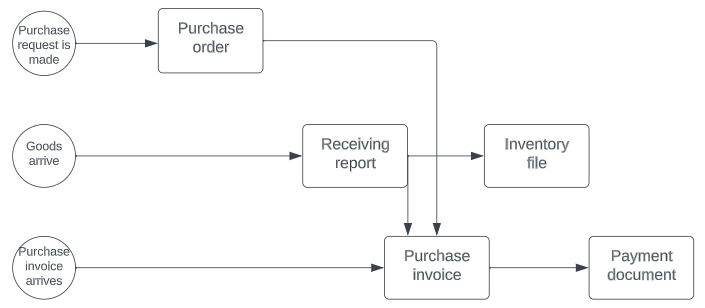
The process that brings inventory into the company is the purchase-to-pay process. In the Figure 5.4 diagram, the purchase process starts when a purchase requisition is made. This triggers the creation of a purchase order which contains information on the products required and prices. Once the goods arrive, a receiving report is created containing the products received. The inventory file is updated to show that we now have the goods. A purchase invoice is received from the supplier. With the information from the purchase invoice, the payment of the supplier can be made.
So what are our goals as an organization? One goal is to purchase what we need, so the correct goods, at a price with which we agree. In order to achieve this goal we might analyze the users and check whether the control of segregation of duties is used. For example, there should be segregation of duties between the person who requests the goods and the person who purchases the goods.
We also want to make sure that the goods we receive are the actual goods we ordered, at the agreed prices. So, we’ll perform an analysis to check the information on the purchase order (or what-should-be) against the information on the receiving report (or what-is).
Because we want to update the inventory file with correct information, we might perform an analysis to confirm that the receiving report information is in line with the purchase order information.
When we receive an invoice, we’ll want to record it. We want to only record invoices for the goods that we want and, in this case, also received. So we’ll check what we ordered (from the purchase order), with what we received (from the receiving report) with what was invoiced by the vendor (from the purchase invoice). This analysis is also called a 3-way match. Only after performing such an analysis we should pay the invoice, making sure this way that we only pay for goods ordered and received.
5.2 Inventory from the production process
Inventory can also be created through the production process. Figure 5.5 contains a typical production process.
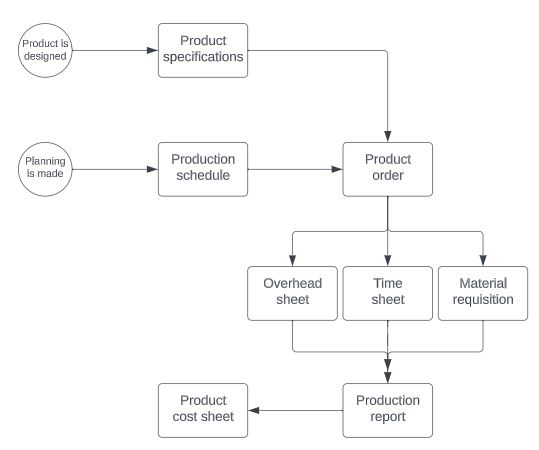
Have you ever cooked a meal from a recipe? I hope you did, otherwise this example is not super useful. A recipe is a document that lists ingredients (e.g., 1 egg, 2 carrots) and instructions (e.g., boil the eggs, chop the carrots). Similarly, the product specification document, contains components of a product and instructions of how to put the components together into a product. You can sometimes find the components of the product in a separate document called Bill of materials, and the instructions for assembling the product in a document called Operations files. For simplicity, we’ll call these documents Product specifications documents. One question we might have with respect to the production process is whether the product specifications are correct. Here, we might check if a segregation of duties is made between the design function and the production function (e.g., the users issuing the product specifications are different than the users making the product). Such segregation allows for the production function to temper the enthusiasm of the design function, which might come up with a very innovative but very complex and inefficient design.
Planning the right production is an art in and of itself. Here, we want to make sure that we don’t produce too much, leading to waste, or we don’t produce too little, leading to dissatisfied customers. The process of making a budget can help us avoid overproduction or underproduction. The creation of a budget is a very helpful exercise but a very challenging one which involves forecasts of product demand and estimations of costs. You usually learn about this part in management accounting courses and operations research courses.
It is also very important that only authorized goods are produced. Let’s consider again the example of preparing a meal for friends. Once we decide on the dish, we need to determine the ingredients that we need (e.g., from product specifications) and how many portions we’ll make (e.g., from the production schedule). Once we ascertain that we have a sufficient inventory of the required ingredients (i.e., raw materials) and we have the time (i.e., available labour) and the instruments required such as knifes or other kitchen utensils needed (e.g., machinery), we can go ahead and prepare the meal. The analysis that we can do here is to check whether there are sufficient materials, labour and machinery capacity to fulfil production orders.
When we prepare a meal we have a recipe with standard information of ingredients to use, time to spent, and instruments to use. But reality is different. With a health concern in mind, we might use only 50g of butter instead of the 85g indicated by the recipe. Or we might spend 30 minutes on preparing the meal, instead of the suggested 20 minutes. Or we might use a spoon instead of the mixer recommended in the recipe. In a production process, the actual use of materials, time and machinery and utilities (b.t.w., I use the title overhead sheet to refer to anything other than direct materials and labour) should be tracked such that the production report can show the correct, actual, use of materials, time and overhead. Ideally, we would track the consumption of materials, time and asset usage automatically. Can you think of how the Internet of Things movement can help here?
Once we have a production report with actual numbers, we can use it to find out the cost per product. Here too, we can perform an analysis to make sure we use correct information in our calculation. We can perform an analysis to check that the values from the budget (e.g., standard units from the budget which indicate what-should-be) against the actual numbers from the production report which show the what-is situation. A variance, which is the difference between what-is and what-should-be, if too BIG, might be an indication that we made a mistake along the way.
Because inventory can be an important asset for many companies, auditors focus a lot of effort on confirming whether the inventory numbers are correct. The chapter on Substantive testing ((Westland 2020)) discusses the audit of inventory. The most relevant part of the chapter for our purposes of using analytics to process accounting data is between pages 229-240. Here, using the simulated accounting data discussed in the previous chapter, we can perform inventory audit procedure.
5.3 Question and application
- What inventory audit procedures are described in the chapter Substantive testing from Westland (2020), pages 229-240?
- Use the same pages (229-240) in chapter Substantive testing from Westland (2020) and work to reproduce the code and perform inventory audit procedures. Interpret the results.
- What type of analysis can we perform in order to make sure we have reliable information related to the inventory?